These are three different ways to show linear relationships.
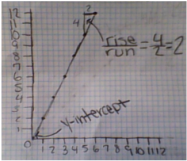
Linear GraphYou can tell this graph is linear because it is a straight line. Also it has a positive slope because it increases at a constant rate. The slope is 2, and the y-intercept is 0. When a graph has a slope and y-intercept then it is linear.
|
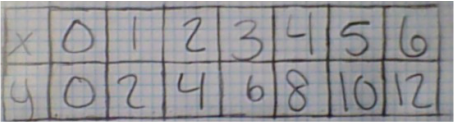
Linear TableAny table that is linear will show a constant rate of change as well. As x increases by 1 y increases by 2. So then the ratio is 1:2, the this would be a linear table with a slope of 2/1 or 2.
|
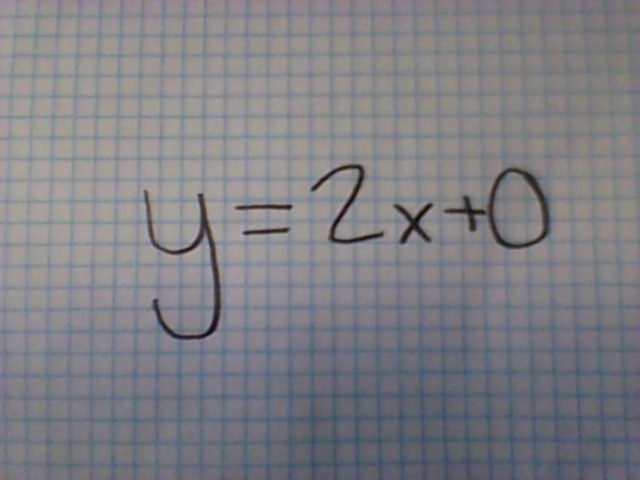
Linear EquationYou know this is a linear equation because it crosses at 0 like on the graph and the slope is the same as the graph. Its written in a linear equation format- y=mx+b.
|
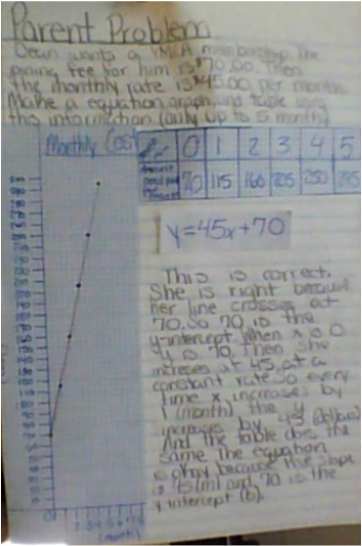
Parent Problem